
 Nhiệt độ
| Max. Temperature °C (°F) | Avg. Temperature °C (°F) | Min. Temperature °C (°F) | Precipitation / Rainfall mm (in) | Humidity | Rainy days | |
|---|---|---|---|---|---|---|
| January |
30.7 (87.3) |
26 (78.8) |
21.3 (87.3) |
18 (0.7) |
63% | 3 |
| February |
32.1 (89.7) |
27.4 (81.4) |
23.2 (89.7) |
15 (0.6) |
67% | 3 |
| March |
33.4 (92.2) |
28.8 (83.8) |
25.1 (92.2) |
45 (1.8) |
68% | 7 |
| April |
34.4 (93.9) |
29.9 (85.8) |
26.5 (93.9) |
72 (2.8) |
69% | 11 |
| May |
33 (91.4) |
29.1 (84.4) |
26.3 (91.4) |
137 (5.4) |
75% | 21 |
| June |
32.1 (89.8) |
28.5 (83.3) |
25.9 (89.8) |
133 (5.2) |
76% | 21 |
| July |
31.5 (88.7) |
28 (82.4) |
25.5 (88.7) |
141 (5.6) |
77% | 23 |
| August |
31.5 (88.6) |
27.8 (82.1) |
25.3 (88.6) |
150 (5.9) |
77% | 24 |
| September |
30.9 (87.7) |
27.3 (81.2) |
24.9 (87.7) |
244 (9.6) |
81% | 24 |
| October |
30.6 (87.1) |
27 (80.5) |
24.1 (87.1) |
196 (7.7) |
81% | 20 |
| November |
30.9 (87.7) |
26.7 (80.1) |
23 (87.7) |
46 (1.8) |
69% | 7 |
| December |
30.5 (86.9) |
25.9 (78.6) |
21.3 (86.9) |
10 (0.4) |
60% | 2 |
| January | February | March | April | May | June | July | August | September | October | November | December | |
|---|---|---|---|---|---|---|---|---|---|---|---|---|
| Avg. Temperature °C (°F) |
26 °C (78.8) |
27.4 °C (81.4) |
28.8 °C (83.8) |
29.9 °C (85.8) |
29.1 °C (84.4) |
28.5 °C (83.3) |
28 °C (82.4) |
27.8 °C (82.1) |
27.3 °C (81.2) |
27 °C (80.5) |
26.7 °C (80.1) |
25.9 °C (78.6) |
| Min. Temperature °C (°F) |
21.3 °C (70.3) |
23.2 °C (73.7) |
25.1 °C (77.1) |
26.5 °C (79.6) |
26.3 °C (79.3) |
25.9 °C (78.6) |
25.5 °C (77.9) |
25.3 °C (77.6) |
24.9 °C (76.8) |
24.1 °C (75.4) |
23 °C (73.4) |
21.3 °C (70.4) |
| Max. Temperature °C (°F) |
30.7 °C (87.3) |
32.1 °C (89.7) |
33.4 °C (92.2) |
34.4 °C (93.9) |
33 °C (91.4) |
32.1 °C (89.8) |
31.5 °C (88.7) |
31.5 °C (88.6) |
30.9 °C (87.7) |
30.6 °C (87.1) |
30.9 °C (87.7) |
30.5 °C (86.9) |
| Precipitation / Rainfall mm (in) |
18 (0.7) |
15 (0.6) |
45 (1.8) |
72 (2.8) |
137 (5.4) |
133 (5.2) |
141 (5.6) |
150 (5.9) |
244 (9.6) |
196 (7.7) |
46 (1.8) |
10 (0.4) |
| Humidity | 63% | 67% | 68% | 69% | 75% | 76% | 77% | 77% | 81% | 81% | 69% | 60% |
| Rainy days | 3 | 3 | 7 | 11 | 21 | 21 | 23 | 24 | 24 | 20 | 7 | 2 |
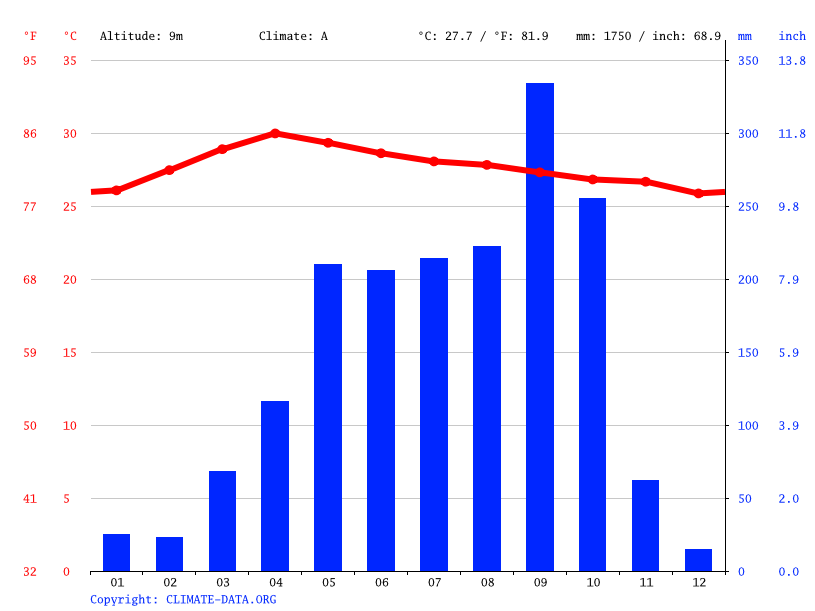
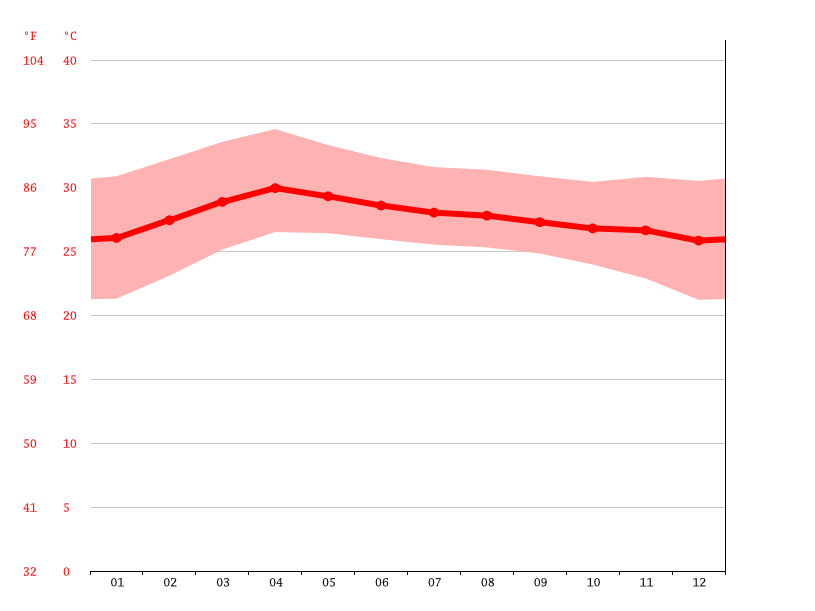
The climate here is tropical. The summers here have a good deal of rainfall, while the winters have very little. This climate is considered to be Aw according to the Köppen-Geiger climate classification. The average temperature in Bangkok is 28.1 °C. About 1430 mm of precipitation falls annually.
| Max. Temperature °C (°F) | Avg. Temperature °C (°F) | Min. Temperature °C (°F) | Precipitation / Rainfall mm (in) | Humidity | Rainy days | |
|---|---|---|---|---|---|---|
| January |
28.3 (82.9) |
26.6 (79.9) |
25.3 (82.9) |
49 (1.9) |
75% | 8 |
| February |
28.9 (84) |
27.2 (81) |
25.7 (84) |
24 (0.9) |
73% | 4 |
| March |
29.2 (84.6) |
27.7 (81.9) |
26.3 (84.6) |
84 (3.3) |
76% | 11 |
| April |
29.3 (84.7) |
27.9 (82.2) |
26.4 (84.7) |
131 (5.2) |
79% | 19 |
| May |
28.8 (83.9) |
27.7 (81.9) |
26.5 (83.9) |
281 (11.1) |
81% | 25 |
| June |
28.6 (83.5) |
27.6 (81.7) |
26.5 (83.5) |
265 (10.4) |
80% | 23 |
| July |
28.3 (82.9) |
27.4 (81.3) |
26.2 (82.9) |
264 (10.4) |
80% | 23 |
| August |
28.1 (82.5) |
27.2 (80.9) |
26.1 (82.5) |
288 (11.3) |
81% | 24 |
| September |
27.8 (82) |
26.8 (80.2) |
25.6 (82) |
320 (12.6) |
82% | 25 |
| October |
27.7 (81.8) |
26.5 (79.7) |
25.3 (81.8) |
297 (11.7) |
83% | 26 |
| November |
27.9 (82.3) |
26.6 (79.9) |
25.5 (82.3) |
198 (7.8) |
81% | 21 |
| December |
28.1 (82.5) |
26.5 (79.8) |
25.3 (82.5) |
82 (3.2) |
77% | 12 |
| January | February | March | April | May | June | July | August | September | October | November | December | |
|---|---|---|---|---|---|---|---|---|---|---|---|---|
| Avg. Temperature °C (°F) |
26.6 °C (79.9) |
27.2 °C (81) |
27.7 °C (81.9) |
27.9 °C (82.2) |
27.7 °C (81.9) |
27.6 °C (81.7) |
27.4 °C (81.3) |
27.2 °C (80.9) |
26.8 °C (80.2) |
26.5 °C (79.7) |
26.6 °C (79.9) |
26.5 °C (79.8) |
| Min. Temperature °C (°F) |
25.3 °C (77.5) |
25.7 °C (78.3) |
26.3 °C (79.3) |
26.4 °C (79.6) |
26.5 °C (79.6) |
26.5 °C (79.6) |
26.2 °C (79.2) |
26.1 °C (78.9) |
25.6 °C (78.1) |
25.3 °C (77.6) |
25.5 °C (77.9) |
25.3 °C (77.6) |
| Max. Temperature °C (°F) |
28.3 °C (82.9) |
28.9 °C (84) |
29.2 °C (84.6) |
29.3 °C (84.7) |
28.8 °C (83.9) |
28.6 °C (83.5) |
28.3 °C (82.9) |
28.1 °C (82.5) |
27.8 °C (82) |
27.7 °C (81.8) |
27.9 °C (82.3) |
28.1 °C (82.5) |
| Precipitation / Rainfall mm (in) |
49 (1.9) |
24 (0.9) |
84 (3.3) |
131 (5.2) |
281 (11.1) |
265 (10.4) |
264 (10.4) |
288 (11.3) |
320 (12.6) |
297 (11.7) |
198 (7.8) |
82 (3.2) |
| Humidity | 75% | 73% | 76% | 79% | 81% | 80% | 80% | 81% | 82% | 83% | 81% | 77% |
| Rainy days | 8 | 4 | 11 | 19 | 25 | 23 | 23 | 24 | 25 | 26 | 21 | 12 |
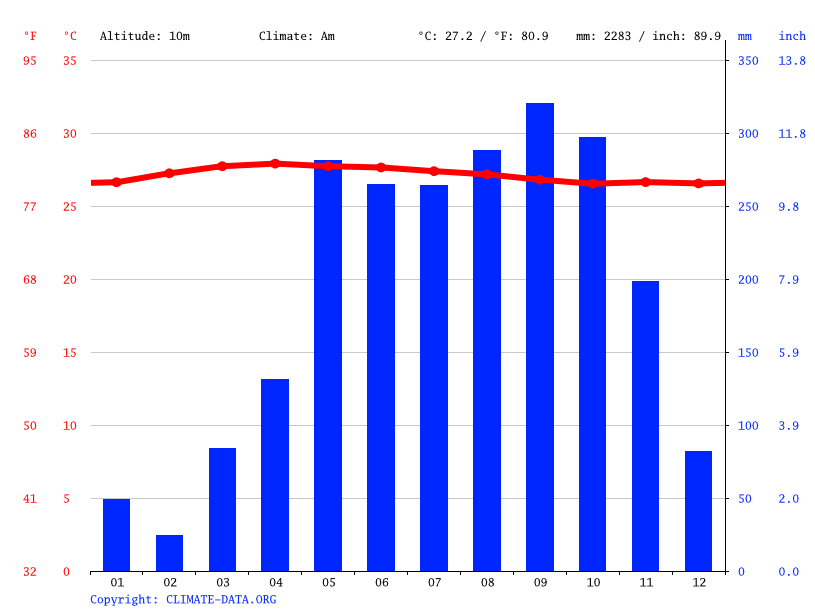
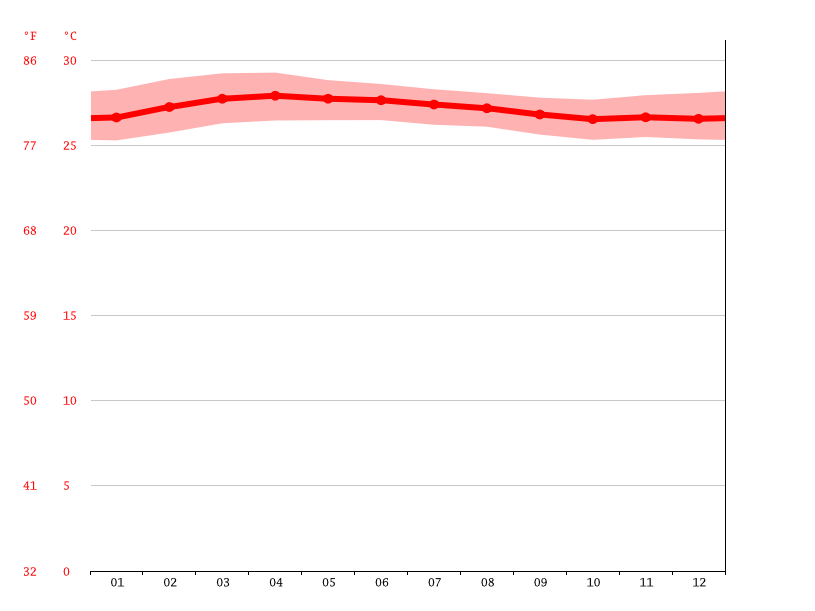
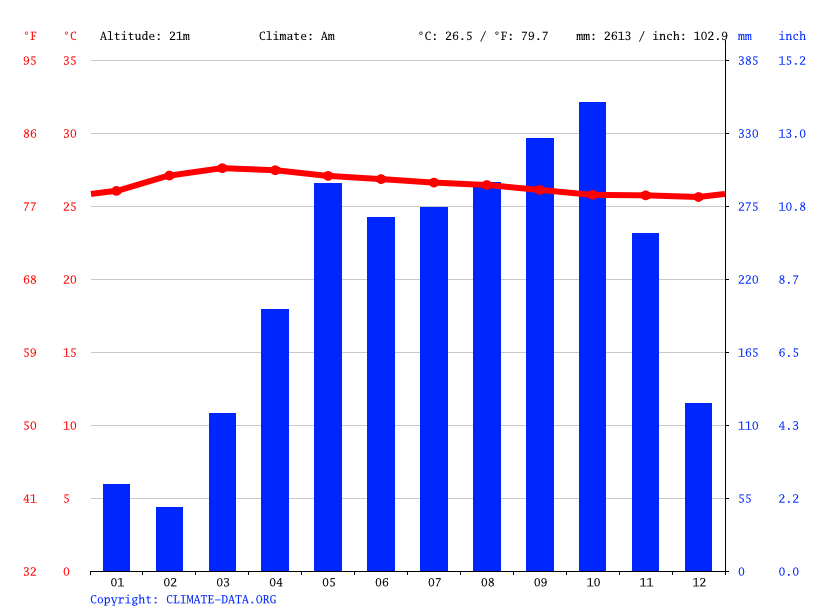
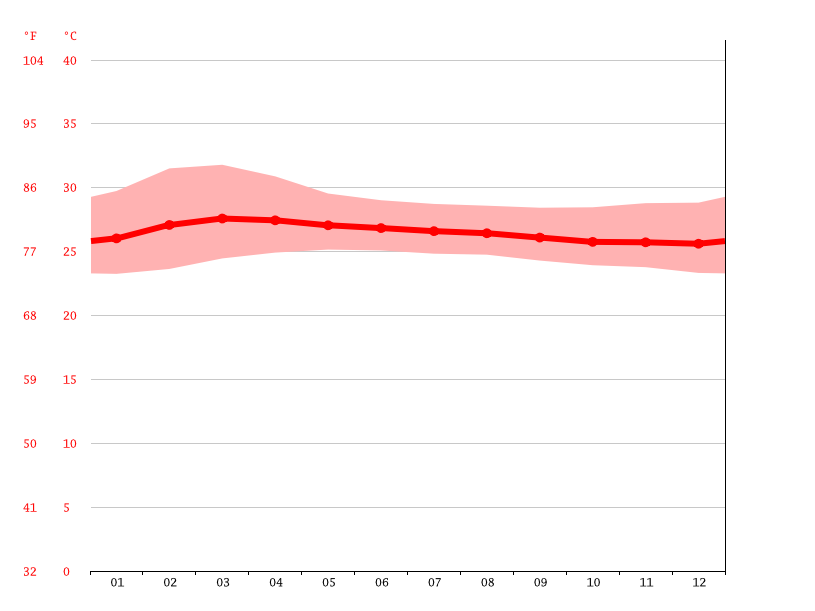
Phuket has a tropical climate. During most months of the year, there is significant rainfall in Phuket. There is only a short dry season. This location is classified as Am by Köppen and Geiger. The average annual temperature is 27.5 °C in Phuket. About 2417 mm of precipitation falls annually.
| Max. Temperature °C (°F) | Avg. Temperature °C (°F) | Min. Temperature °C (°F) | Precipitation / Rainfall mm (in) | Humidity | Rainy days | |
|---|---|---|---|---|---|---|
| January |
27.4 (81.3) |
21.6 (70.9) |
15.4 (81.3) |
8 (0.3) |
64% | 2 |
| February |
30.9 (87.5) |
24.4 (76) |
17.9 (87.5) |
3 (0.1) |
52% | 1 |
| March |
33.4 (92.2) |
27.1 (80.7) |
20.8 (92.2) |
13 (0.5) |
48% | 2 |
| April |
35 (95.1) |
29.1 (84.4) |
23.7 (95.1) |
27 (1.1) |
50% | 5 |
| May |
31.9 (89.4) |
27.4 (81.3) |
23.7 (89.4) |
110 (4.3) |
70% | 15 |
| June |
30 (86.1) |
26.3 (79.3) |
23.5 (86.1) |
129 (5.1) |
79% | 20 |
| July |
29.2 (84.6) |
25.7 (78.2) |
23.1 (84.6) |
186 (7.3) |
82% | 22 |
| August |
28.6 (83.4) |
25.2 (77.4) |
22.8 (83.4) |
240 (9.4) |
86% | 24 |
| September |
28.7 (83.7) |
25.1 (77.2) |
22.3 (83.7) |
235 (9.3) |
86% | 23 |
| October |
28.4 (83.2) |
24.5 (76.2) |
20.9 (83.2) |
121 (4.8) |
83% | 16 |
| November |
27.9 (82.3) |
23.1 (73.6) |
18 (82.3) |
25 (1) |
75% | 5 |
| December |
26.5 (79.8) |
21.1 (70) |
15.1 (79.8) |
11 (0.4) |
70% | 2 |
| January | February | March | April | May | June | July | August | September | October | November | December | |
|---|---|---|---|---|---|---|---|---|---|---|---|---|
| Avg. Temperature °C (°F) |
21.6 °C (70.9) |
24.4 °C (76) |
27.1 °C (80.7) |
29.1 °C (84.4) |
27.4 °C (81.3) |
26.3 °C (79.3) |
25.7 °C (78.2) |
25.2 °C (77.4) |
25.1 °C (77.2) |
24.5 °C (76.2) |
23.1 °C (73.6) |
21.1 °C (70) |
| Min. Temperature °C (°F) |
15.4 °C (59.8) |
17.9 °C (64.2) |
20.8 °C (69.5) |
23.7 °C (74.7) |
23.7 °C (74.7) |
23.5 °C (74.2) |
23.1 °C (73.6) |
22.8 °C (73) |
22.3 °C (72.1) |
20.9 °C (69.6) |
18 °C (64.5) |
15.1 °C (59.3) |
| Max. Temperature °C (°F) |
27.4 °C (81.3) |
30.9 °C (87.5) |
33.4 °C (92.2) |
35 °C (95.1) |
31.9 °C (89.4) |
30 °C (86.1) |
29.2 °C (84.6) |
28.6 °C (83.4) |
28.7 °C (83.7) |
28.4 °C (83.2) |
27.9 °C (82.3) |
26.5 °C (79.8) |
| Precipitation / Rainfall mm (in) |
8 (0.3) |
3 (0.1) |
13 (0.5) |
27 (1.1) |
110 (4.3) |
129 (5.1) |
186 (7.3) |
240 (9.4) |
235 (9.3) |
121 (4.8) |
25 (1) |
11 (0.4) |
| Humidity | 64% | 52% | 48% | 50% | 70% | 79% | 82% | 86% | 86% | 83% | 75% | 70% |
| Rainy days | 2 | 1 | 2 | 5 | 15 | 20 | 22 | 24 | 23 | 16 | 5 | 2 |
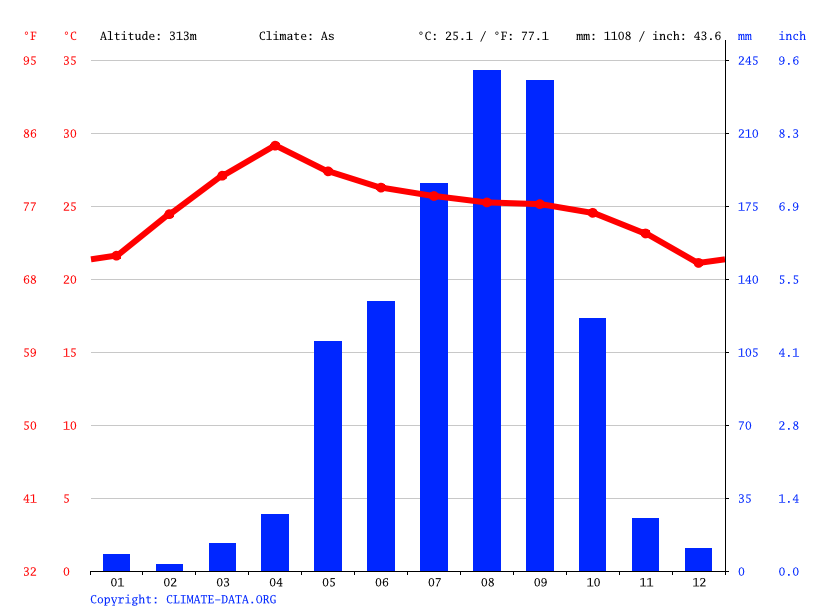
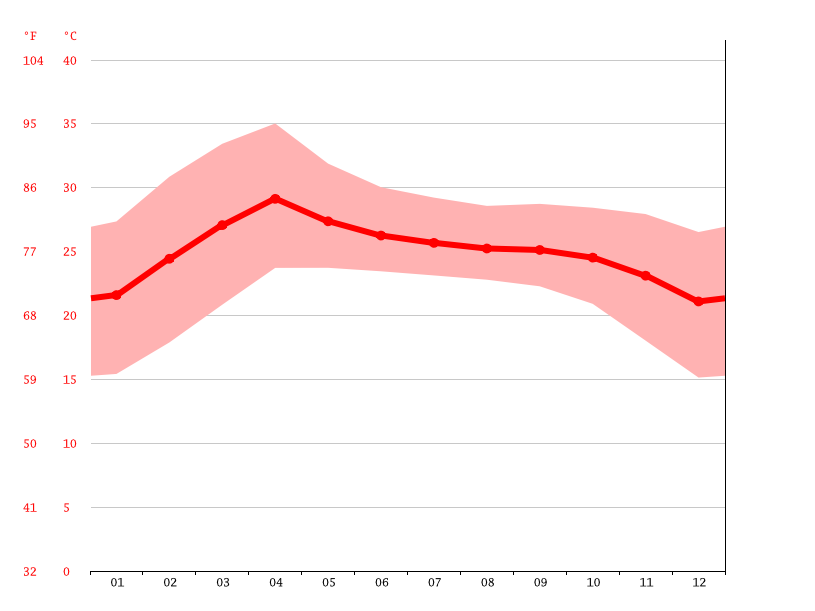
Chiang Mai has a tropical climate. When compared with winter, the summers have much more rainfall. The climate here is classified as Aw by the Köppen-Geiger system. The average annual temperature in Chiang Mai is 25.6 °C. In a year, the average rainfall is 1184 mm.
| Max. Temperature °C (°F) | Avg. Temperature °C (°F) | Min. Temperature °C (°F) | Precipitation / Rainfall mm (in) | Humidity | Rainy days | |
|---|---|---|---|---|---|---|
| January |
29.9 (85.7) |
25.8 (78.5) |
22.3 (85.7) |
30 (1.2) |
66% | 6 |
| February |
30.3 (86.6) |
26.6 (80) |
23.6 (86.6) |
30 (1.2) |
73% | 7 |
| March |
31 (87.7) |
27.6 (81.7) |
25 (87.7) |
69 (2.7) |
75% | 13 |
| April |
31.5 (88.7) |
28.5 (83.3) |
26.1 (88.7) |
94 (3.7) |
76% | 15 |
| May |
30.7 (87.3) |
28.3 (82.9) |
26.3 (87.3) |
161 (6.3) |
79% | 22 |
| June |
30.2 (86.4) |
28 (82.3) |
26.2 (86.4) |
148 (5.8) |
78% | 23 |
| July |
29.9 (85.9) |
27.7 (81.8) |
25.9 (85.9) |
156 (6.1) |
78% | 24 |
| August |
29.8 (85.7) |
27.5 (81.6) |
25.7 (85.7) |
159 (6.3) |
78% | 24 |
| September |
29.4 (84.8) |
27 (80.6) |
25.2 (84.8) |
246 (9.7) |
82% | 25 |
| October |
29.3 (84.8) |
26.5 (79.7) |
24.5 (84.8) |
225 (8.9) |
83% | 23 |
| November |
29.7 (85.5) |
26.4 (79.4) |
23.6 (85.5) |
57 (2.2) |
73% | 8 |
| December |
29.7 (85.4) |
25.8 (78.4) |
22.2 (85.4) |
15 (0.6) |
64% | 4 |
| January | February | March | April | May | June | July | August | September | October | November | December | |
|---|---|---|---|---|---|---|---|---|---|---|---|---|
| Avg. Temperature °C (°F) |
25.8 °C (78.5) |
26.6 °C (80) |
27.6 °C (81.7) |
28.5 °C (83.3) |
28.3 °C (82.9) |
28 °C (82.3) |
27.7 °C (81.8) |
27.5 °C (81.6) |
27 °C (80.6) |
26.5 °C (79.7) |
26.4 °C (79.4) |
25.8 °C (78.4) |
| Min. Temperature °C (°F) |
22.3 °C (72.2) |
23.6 °C (74.4) |
25 °C (77.1) |
26.1 °C (79.1) |
26.3 °C (79.3) |
26.2 °C (79.1) |
25.9 °C (78.6) |
25.7 °C (78.3) |
25.2 °C (77.4) |
24.5 °C (76.1) |
23.6 °C (74.6) |
22.2 °C (72) |
| Max. Temperature °C (°F) |
29.9 °C (85.7) |
30.3 °C (86.6) |
31 °C (87.7) |
31.5 °C (88.7) |
30.7 °C (87.3) |
30.2 °C (86.4) |
29.9 °C (85.9) |
29.8 °C (85.7) |
29.4 °C (84.8) |
29.3 °C (84.8) |
29.7 °C (85.5) |
29.7 °C (85.4) |
| Precipitation / Rainfall mm (in) |
30 (1.2) |
30 (1.2) |
69 (2.7) |
94 (3.7) |
161 (6.3) |
148 (5.8) |
156 (6.1) |
159 (6.3) |
246 (9.7) |
225 (8.9) |
57 (2.2) |
15 (0.6) |
| Humidity | 66% | 73% | 75% | 76% | 79% | 78% | 78% | 78% | 82% | 83% | 73% | 64% |
| Rainy days | 6 | 7 | 13 | 15 | 22 | 23 | 24 | 24 | 25 | 23 | 8 | 4 |
The climate here is tropical. In winter, there is much less rainfall than in summer. This climate is considered to be Aw according to the Köppen-Geiger climate classification. In Pattaya, the average annual temperature is 28.3 °C. The rainfall here averages 1241 mm.
| Max. Temperature °C (°F) | Avg. Temperature °C (°F) | Min. Temperature °C (°F) | Precipitation / Rainfall mm (in) | Humidity | Rainy days | |
|---|---|---|---|---|---|---|
| January |
29.7 (85.5) |
26 (78.9) |
23.3 (85.5) |
65 (2.6) |
77% | 8 |
| February |
31.5 (88.7) |
27.1 (80.8) |
23.6 (88.7) |
48 (1.9) |
71% | 6 |
| March |
31.8 (89.2) |
27.6 (81.7) |
24.5 (89.2) |
119 (4.7) |
75% | 14 |
| April |
30.9 (87.6) |
27.4 (81.4) |
24.9 (87.6) |
197 (7.8) |
82% | 22 |
| May |
29.5 (85.2) |
27.1 (80.7) |
25.2 (85.2) |
292 (11.5) |
86% | 26 |
| June |
29 (84.2) |
26.8 (80.3) |
25.1 (84.2) |
266 (10.5) |
86% | 24 |
| July |
28.7 (83.7) |
26.6 (79.9) |
24.8 (83.7) |
274 (10.8) |
86% | 25 |
| August |
28.6 (83.5) |
26.4 (79.6) |
24.8 (83.5) |
293 (11.5) |
86% | 26 |
| September |
28.4 (83.2) |
26.1 (79) |
24.3 (83.2) |
326 (12.8) |
87% | 25 |
| October |
28.5 (83.2) |
25.8 (78.4) |
23.9 (83.2) |
353 (13.9) |
89% | 27 |
| November |
28.8 (83.8) |
25.7 (78.3) |
23.8 (83.8) |
254 (10) |
87% | 22 |
| December |
28.8 (83.9) |
25.6 (78.1) |
23.3 (83.9) |
126 (5) |
83% | 14 |
| January | February | March | April | May | June | July | August | September | October | November | December | |
|---|---|---|---|---|---|---|---|---|---|---|---|---|
| Avg. Temperature °C (°F) |
26 °C (78.9) |
27.1 °C (80.8) |
27.6 °C (81.7) |
27.4 °C (81.4) |
27.1 °C (80.7) |
26.8 °C (80.3) |
26.6 °C (79.9) |
26.4 °C (79.6) |
26.1 °C (79) |
25.8 °C (78.4) |
25.7 °C (78.3) |
25.6 °C (78.1) |
| Min. Temperature °C (°F) |
23.3 °C (73.9) |
23.6 °C (74.6) |
24.5 °C (76) |
24.9 °C (76.9) |
25.2 °C (77.3) |
25.1 °C (77.2) |
24.8 °C (76.7) |
24.8 °C (76.6) |
24.3 °C (75.7) |
23.9 °C (75.1) |
23.8 °C (74.8) |
23.3 °C (74) |
| Max. Temperature °C (°F) |
29.7 °C (85.5) |
31.5 °C (88.7) |
31.8 °C (89.2) |
30.9 °C (87.6) |
29.5 °C (85.2) |
29 °C (84.2) |
28.7 °C (83.7) |
28.6 °C (83.5) |
28.4 °C (83.2) |
28.5 °C (83.2) |
28.8 °C (83.8) |
28.8 °C (83.9) |
| Precipitation / Rainfall mm (in) |
65 (2.6) |
48 (1.9) |
119 (4.7) |
197 (7.8) |
292 (11.5) |
266 (10.5) |
274 (10.8) |
293 (11.5) |
326 (12.8) |
353 (13.9) |
254 (10) |
126 (5) |
| Humidity | 77% | 71% | 75% | 82% | 86% | 86% | 86% | 86% | 87% | 89% | 87% | 83% |
| Rainy days | 8 | 6 | 14 | 22 | 26 | 24 | 25 | 26 | 25 | 27 | 22 | 14 |
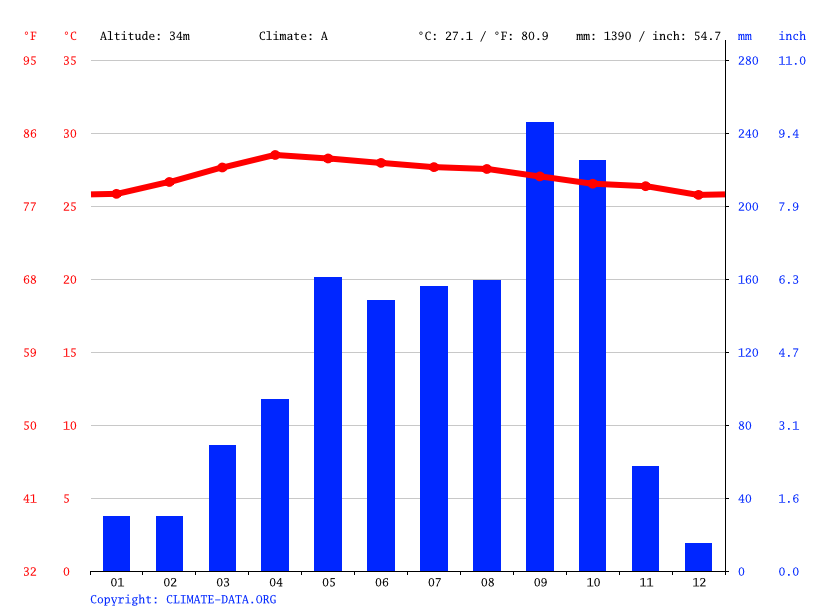
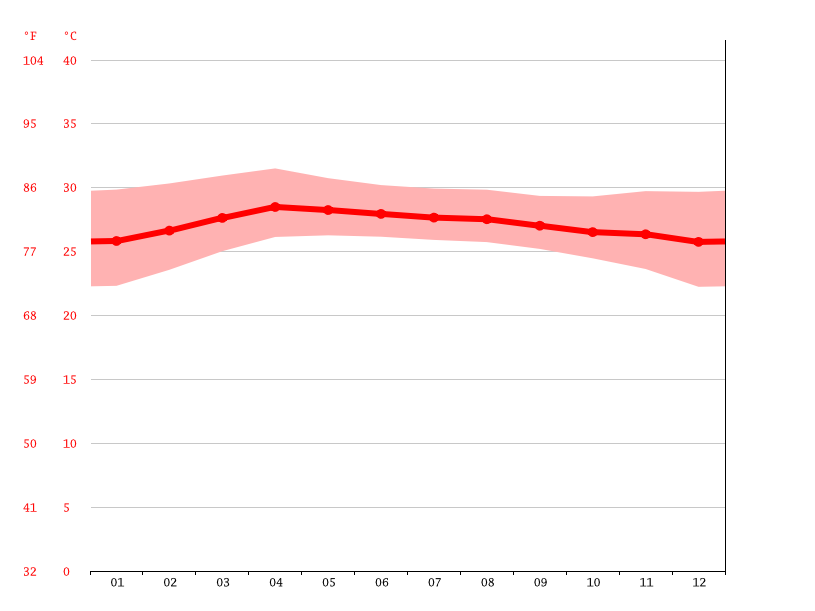
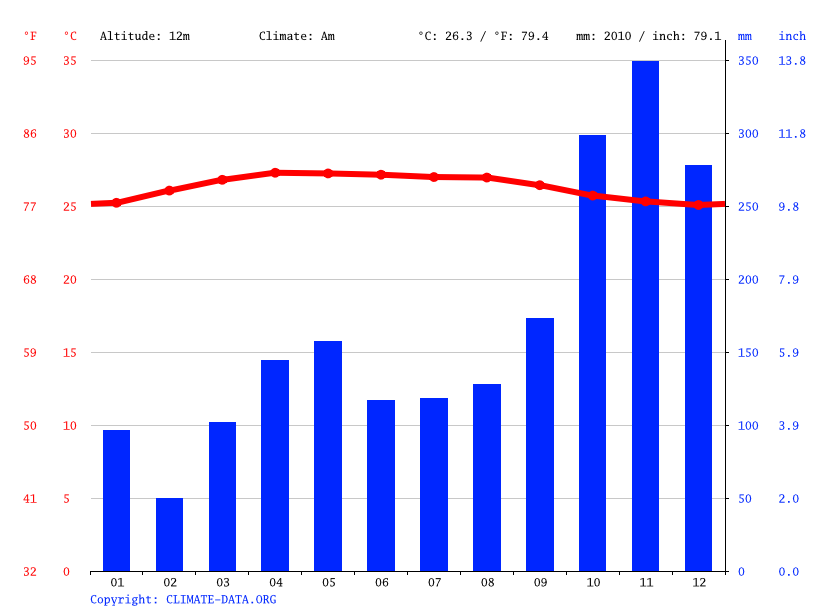
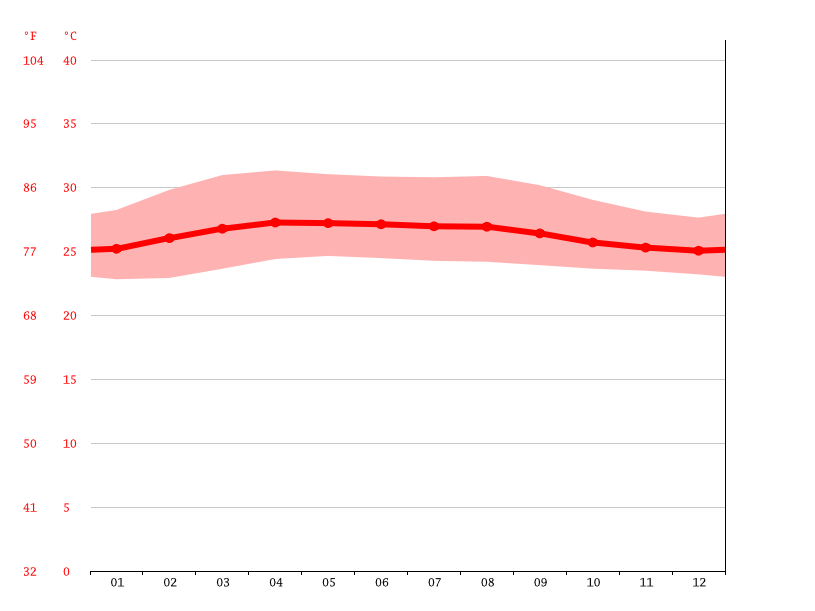
Krabi's climate is classified as tropical. Most months of the year are marked by significant rainfall. The short dry season has little impact. The Köppen-Geiger climate classification is Am. The average annual temperature is 27.3 °C in Krabi. About 2040 mm of precipitation falls annually.
| Max. Temperature °C (°F) | Avg. Temperature °C (°F) | Min. Temperature °C (°F) | Precipitation / Rainfall mm (in) | Humidity | Rainy days | |
|---|---|---|---|---|---|---|
| January |
28.3 (82.9) |
25.2 (77.4) |
22.8 (82.9) |
96 (3.8) |
81% | 14 |
| February |
29.8 (85.7) |
26.1 (78.9) |
22.9 (85.7) |
50 (2) |
77% | 9 |
| March |
31 (87.8) |
26.8 (80.2) |
23.7 (87.8) |
102 (4) |
78% | 14 |
| April |
31.4 (88.4) |
27.3 (81.1) |
24.4 (88.4) |
144 (5.7) |
80% | 20 |
| May |
31.1 (87.9) |
27.2 (81) |
24.7 (87.9) |
157 (6.2) |
83% | 23 |
| June |
30.9 (87.6) |
27.1 (80.9) |
24.5 (87.6) |
117 (4.6) |
81% | 19 |
| July |
30.8 (87.5) |
27 (80.6) |
24.3 (87.5) |
118 (4.6) |
81% | 20 |
| August |
30.9 (87.7) |
26.9 (80.5) |
24.2 (87.7) |
128 (5) |
80% | 21 |
| September |
30.2 (86.4) |
26.4 (79.6) |
23.9 (86.4) |
173 (6.8) |
83% | 24 |
| October |
29.1 (84.3) |
25.7 (78.3) |
23.7 (84.3) |
298 (11.7) |
88% | 27 |
| November |
28.1 (82.6) |
25.3 (77.6) |
23.5 (82.6) |
349 (13.7) |
89% | 26 |
| December |
27.7 (81.8) |
25.1 (77.1) |
23.2 (81.8) |
278 (10.9) |
86% | 22 |
| January | February | March | April | May | June | July | August | September | October | November | December | |
|---|---|---|---|---|---|---|---|---|---|---|---|---|
| Avg. Temperature °C (°F) |
25.2 °C (77.4) |
26.1 °C (78.9) |
26.8 °C (80.2) |
27.3 °C (81.1) |
27.2 °C (81) |
27.1 °C (80.9) |
27 °C (80.6) |
26.9 °C (80.5) |
26.4 °C (79.6) |
25.7 °C (78.3) |
25.3 °C (77.6) |
25.1 °C (77.1) |
| Min. Temperature °C (°F) |
22.8 °C (73.1) |
22.9 °C (73.3) |
23.7 °C (74.6) |
24.4 °C (76) |
24.7 °C (76.4) |
24.5 °C (76.1) |
24.3 °C (75.7) |
24.2 °C (75.6) |
23.9 °C (75.1) |
23.7 °C (74.6) |
23.5 °C (74.3) |
23.2 °C (73.8) |
| Max. Temperature °C (°F) |
28.3 °C (82.9) |
29.8 °C (85.7) |
31 °C (87.8) |
31.4 °C (88.4) |
31.1 °C (87.9) |
30.9 °C (87.6) |
30.8 °C (87.5) |
30.9 °C (87.7) |
30.2 °C (86.4) |
29.1 °C (84.3) |
28.1 °C (82.6) |
27.7 °C (81.8) |
| Precipitation / Rainfall mm (in) |
96 (3.8) |
50 (2) |
102 (4) |
144 (5.7) |
157 (6.2) |
117 (4.6) |
118 (4.6) |
128 (5) |
173 (6.8) |
298 (11.7) |
349 (13.7) |
278 (10.9) |
| Humidity | 81% | 77% | 78% | 80% | 83% | 81% | 81% | 80% | 83% | 88% | 89% | 86% |
| Rainy days | 14 | 9 | 14 | 20 | 23 | 19 | 20 | 21 | 24 | 27 | 26 | 22 |
The climate is tropical in Hat Yai. When compared with winter, the summers have much more rainfall. According to Köppen and Geiger, this climate is classified as Aw. The average annual temperature in Hat Yai is 27.3 °C. About 1877 mm of precipitation falls annually.