-
 Đô la Mỹ - USD ($)
Tiền tệ của Hoa Kỳ
Đô la Mỹ - USD ($)
Tiền tệ của Hoa Kỳ -
 Euro - EUR (€)
Tiền tệ của Liên minh châu Âu
Euro - EUR (€)
Tiền tệ của Liên minh châu Âu -
 Đồng Bảng Anh - GBP (£)
Tiền tệ của Vương quốc Anh, Lãnh thổ Ấn Độ Dương thuộc Anh, Đảo Man, Jersey, Guernsey
Đồng Bảng Anh - GBP (£)
Tiền tệ của Vương quốc Anh, Lãnh thổ Ấn Độ Dương thuộc Anh, Đảo Man, Jersey, Guernsey -
 Đô la Canada - CAD (CA$)
Tiền tệ của Canada
Đô la Canada - CAD (CA$)
Tiền tệ của Canada -
 Yen Nhật - JPY (¥)
Tiền tệ của Nhật Bản
Yen Nhật - JPY (¥)
Tiền tệ của Nhật Bản -
 Đồng peso Mexican - MXN (MX$)
Tiền tệ của México
Đồng peso Mexican - MXN (MX$)
Tiền tệ của México -
 Franc Thụy Sĩ - CHF (CHF)
Tiền tệ của Thụy Sĩ, Liechtenstein, Campione d'Italia
Franc Thụy Sĩ - CHF (CHF)
Tiền tệ của Thụy Sĩ, Liechtenstein, Campione d'Italia -
 bitcoin - BTC (₿)
Tiền tệ của Trên toàn thế giới
bitcoin - BTC (₿)
Tiền tệ của Trên toàn thế giới -
 Các tiểu vương quốc Ả Rập thống nhất Dirham - AED (AED)
Tiền tệ của các Tiểu Vương Quốc Ả Rập Thống Nhất
Các tiểu vương quốc Ả Rập thống nhất Dirham - AED (AED)
Tiền tệ của các Tiểu Vương Quốc Ả Rập Thống Nhất -
 người Afghanistan Afghanistan - AFN (Af)
Tiền tệ của Afghanistan
người Afghanistan Afghanistan - AFN (Af)
Tiền tệ của Afghanistan -
 Lek Albania - ALL (L)
Tiền tệ của Albania
Lek Albania - ALL (L)
Tiền tệ của Albania -
 kịch Armenia - AMD (AMD)
Tiền tệ của Armenia
kịch Armenia - AMD (AMD)
Tiền tệ của Armenia -
 bang hội - ANG (NAƒ)
Tiền tệ của Curaçao, Sint Maarten
bang hội - ANG (NAƒ)
Tiền tệ của Curaçao, Sint Maarten -
 Kwanza - AOA (Kz)
Tiền tệ của Ăng-gô-la
Kwanza - AOA (Kz)
Tiền tệ của Ăng-gô-la -
 Peso Argentina - ARS (AR$)
Tiền tệ của Argentina
Peso Argentina - ARS (AR$)
Tiền tệ của Argentina -
 Đô la Úc - AUD (AU$)
Tiền tệ của Úc, Đảo Christmas, Quần đảo Cocos (Keeling), Đảo Heard và Quần đảo McDonald, Kiribati, Nauru, Đảo Norfolk, Tuvalu
Đô la Úc - AUD (AU$)
Tiền tệ của Úc, Đảo Christmas, Quần đảo Cocos (Keeling), Đảo Heard và Quần đảo McDonald, Kiribati, Nauru, Đảo Norfolk, Tuvalu -
 Florin - AWG (Afl)
Tiền tệ của Aruba
Florin - AWG (Afl)
Tiền tệ của Aruba -
 Manat của Azerbaijan - AZN (man.)
Tiền tệ của Azerbaijan
Manat của Azerbaijan - AZN (man.)
Tiền tệ của Azerbaijan -
 Nhãn hiệu mui trần Bosnia-Herzegovina - BAM (KM)
Tiền tệ của Bosnia và Herzegovina
Nhãn hiệu mui trần Bosnia-Herzegovina - BAM (KM)
Tiền tệ của Bosnia và Herzegovina -
 Đô la Bajan - BBD (Bds$)
Tiền tệ của Barbados
Đô la Bajan - BBD (Bds$)
Tiền tệ của Barbados -
 Taka Bangladesh - BDT (Tk)
Tiền tệ của Bangladesh
Taka Bangladesh - BDT (Tk)
Tiền tệ của Bangladesh -
 Lev Bungari - BGN (BGN)
Tiền tệ của Bulgaria
Lev Bungari - BGN (BGN)
Tiền tệ của Bulgaria -
 Dinar Bahrain - BHD (BD)
Tiền tệ của Bahrain
Dinar Bahrain - BHD (BD)
Tiền tệ của Bahrain -
 Franc Burundi - BIF (FBu)
Tiền tệ của Burundi
Franc Burundi - BIF (FBu)
Tiền tệ của Burundi -
 Đô la Bermuda - BMD (BD$)
Tiền tệ của Bermuda
Đô la Bermuda - BMD (BD$)
Tiền tệ của Bermuda -
 Đô la Brunei - BND (BN$)
Tiền tệ của Brunei
Đô la Brunei - BND (BN$)
Tiền tệ của Brunei -
 Boliviano Bolivia - BOB (Bs)
Tiền tệ của Bôlivia
Boliviano Bolivia - BOB (Bs)
Tiền tệ của Bôlivia -
 Real Brazil - BRL (R$)
Tiền tệ của Brazil
Real Brazil - BRL (R$)
Tiền tệ của Brazil -
 Đô la Bahamas - BSD (B$)
Tiền tệ của Bahamas
Đô la Bahamas - BSD (B$)
Tiền tệ của Bahamas -
 Ngultrum - BTN (Nu.)
Tiền tệ của Bhutan
Ngultrum - BTN (Nu.)
Tiền tệ của Bhutan -
 Pula Botswana - BWP (BWP)
Tiền tệ của Botswana
Pula Botswana - BWP (BWP)
Tiền tệ của Botswana -
 Đồng Rúp Belarus - BYN (BYN)
Tiền tệ của Bêlarut
Đồng Rúp Belarus - BYN (BYN)
Tiền tệ của Bêlarut -
 Đô la Belize - BZD (BZ$)
Tiền tệ của Belize
Đô la Belize - BZD (BZ$)
Tiền tệ của Belize -
 Franc Congo - CDF (CDF)
Tiền tệ của Cộng hòa Dân chủ Congo
Franc Congo - CDF (CDF)
Tiền tệ của Cộng hòa Dân chủ Congo -
 Peso Chilê - CLP (CL$)
Tiền tệ của Chilê
Peso Chilê - CLP (CL$)
Tiền tệ của Chilê -
 Nhân dân tệ của Trung Quốc - CNY (CN¥)
Tiền tệ của Trung Quốc
Nhân dân tệ của Trung Quốc - CNY (CN¥)
Tiền tệ của Trung Quốc -
 Đồng Peso Colombia - COP (CO$)
Tiền tệ của Colombia
Đồng Peso Colombia - COP (CO$)
Tiền tệ của Colombia -
 Colon Costa Rica - CRC (₡)
Tiền tệ của Costa Rica
Colon Costa Rica - CRC (₡)
Tiền tệ của Costa Rica -
 Peso chuyển đổi Cuba - CUC (CUC$)
Tiền tệ của Cuba
Peso chuyển đổi Cuba - CUC (CUC$)
Tiền tệ của Cuba -
Peso Cuba - CUP ($MN)
Tiền tệ của Cuba
-
 Escudo Cape Verde - CVE (CV$)
Tiền tệ của Cabo Verde
Escudo Cape Verde - CVE (CV$)
Tiền tệ của Cabo Verde -
 Koruna Cộng hòa Séc - CZK (Kč)
Tiền tệ của Cộng hòa Séc
Koruna Cộng hòa Séc - CZK (Kč)
Tiền tệ của Cộng hòa Séc -
 Franc Djibouti - DJF (Fdj)
Tiền tệ của Djibouti
Franc Djibouti - DJF (Fdj)
Tiền tệ của Djibouti -
 Krone Đan Mạch - DKK (Dkr)
Tiền tệ của Đan Mạch, Quần đảo Faroe, Greenland
Krone Đan Mạch - DKK (Dkr)
Tiền tệ của Đan Mạch, Quần đảo Faroe, Greenland -
 Peso Dominica - DOP (RD$)
Tiền tệ của Cộng hòa Dominica
Peso Dominica - DOP (RD$)
Tiền tệ của Cộng hòa Dominica -
 Dinar Algeria - DZD (DA)
Tiền tệ của Algérie
Dinar Algeria - DZD (DA)
Tiền tệ của Algérie -
 Bảng Ai Cập - EGP (EGP)
Tiền tệ của Ai Cập
Bảng Ai Cập - EGP (EGP)
Tiền tệ của Ai Cập -
 Eritrea Nakfa - ERN (Nfk)
Tiền tệ của Eritrea
Eritrea Nakfa - ERN (Nfk)
Tiền tệ của Eritrea -
 Birr Ethiopia - ETB (Br)
Tiền tệ của Ethiopia
Birr Ethiopia - ETB (Br)
Tiền tệ của Ethiopia -
 Đô la Fiji - FJD (FJ$)
Tiền tệ của Fiji
Đô la Fiji - FJD (FJ$)
Tiền tệ của Fiji -
 Bảng Quần đảo Falkland - FKP (£)
Tiền tệ của Quần đảo Falkland
Bảng Quần đảo Falkland - FKP (£)
Tiền tệ của Quần đảo Falkland -
 Tiếng Lari Georgia - GEL (GEL)
Tiền tệ của Gruzia
Tiếng Lari Georgia - GEL (GEL)
Tiền tệ của Gruzia -
 Bảng Guernsey - GGP (£)
Tiền tệ của Guernsey
Bảng Guernsey - GGP (£)
Tiền tệ của Guernsey -
 Cedi Ghana - GHS (GH₵)
Tiền tệ của Ghana
Cedi Ghana - GHS (GH₵)
Tiền tệ của Ghana -
 Bảng Gibraltar - GIP (£)
Tiền tệ của Gibraltar
Bảng Gibraltar - GIP (£)
Tiền tệ của Gibraltar -
 Dalasi - GMD (D)
Tiền tệ của Gambia
Dalasi - GMD (D)
Tiền tệ của Gambia -
 Franc Guinea - GNF (FG)
Tiền tệ của Ghi-nê
Franc Guinea - GNF (FG)
Tiền tệ của Ghi-nê -
 Quetzal Guatemala - GTQ (GTQ)
Tiền tệ của Guatemala
Quetzal Guatemala - GTQ (GTQ)
Tiền tệ của Guatemala -
 Đô la Guyana - GYD (G$)
Tiền tệ của Guyana
Đô la Guyana - GYD (G$)
Tiền tệ của Guyana -
 Đôla Hong Kong - HKD (HK$)
Tiền tệ của Hồng Kông
Đôla Hong Kong - HKD (HK$)
Tiền tệ của Hồng Kông -
 Honduras Lempira - HNL (HNL)
Tiền tệ của Honduras
Honduras Lempira - HNL (HNL)
Tiền tệ của Honduras -
 Kuna Croatia - HRK (kn)
Tiền tệ của Croatia
Kuna Croatia - HRK (kn)
Tiền tệ của Croatia -
 bầu bí - HTG (G)
Tiền tệ của Haiti
bầu bí - HTG (G)
Tiền tệ của Haiti -
 Forint Hungary - HUF (Ft)
Tiền tệ của Hungary
Forint Hungary - HUF (Ft)
Tiền tệ của Hungary -
 Rupiah Indonesia - IDR (Rp)
Tiền tệ của Indonesia
Rupiah Indonesia - IDR (Rp)
Tiền tệ của Indonesia -
 Sheqel Mới của Israel - ILS (₪)
Tiền tệ của Người israel
Sheqel Mới của Israel - ILS (₪)
Tiền tệ của Người israel -
 bảng Anh - IMP (M£)
Tiền tệ của Đảo Man
bảng Anh - IMP (M£)
Tiền tệ của Đảo Man -
 Rupee Ấn Độ - INR (Rs)
Tiền tệ của Ấn Độ
Rupee Ấn Độ - INR (Rs)
Tiền tệ của Ấn Độ -
 Dinar Iraq - IQD (IQD)
Tiền tệ của Irắc
Dinar Iraq - IQD (IQD)
Tiền tệ của Irắc -
 Rial của Iran - IRR (IRR)
Tiền tệ của Iran
Rial của Iran - IRR (IRR)
Tiền tệ của Iran -
 Tiếng Iceland Krona - ISK (Ikr)
Tiền tệ của Nước Iceland
Tiếng Iceland Krona - ISK (Ikr)
Tiền tệ của Nước Iceland -
 Jersey Pound - JEP (£)
Tiền tệ của áo đấu
Jersey Pound - JEP (£)
Tiền tệ của áo đấu -
 Đô la Jamaica - JMD (J$)
Tiền tệ của Jamaica
Đô la Jamaica - JMD (J$)
Tiền tệ của Jamaica -
 Dinar Jordan - JOD (JD)
Tiền tệ của Jordan
Dinar Jordan - JOD (JD)
Tiền tệ của Jordan -
 Shilling Kenya - KES (Ksh)
Tiền tệ của Kenya
Shilling Kenya - KES (Ksh)
Tiền tệ của Kenya -
 Som - KGS (Лв)
Tiền tệ của Kyrgyzstan
Som - KGS (Лв)
Tiền tệ của Kyrgyzstan -
 Riel Campuchia - KHR (KHR)
Tiền tệ của Campuchia
Riel Campuchia - KHR (KHR)
Tiền tệ của Campuchia -
 Franc Comorian - KMF (CF)
Tiền tệ của Comoros
Franc Comorian - KMF (CF)
Tiền tệ của Comoros -
 Thắng - KPW (₩)
Tiền tệ của Bắc Triều Tiên
Thắng - KPW (₩)
Tiền tệ của Bắc Triều Tiên -
 Won Hàn Quốc - KRW (₩)
Tiền tệ của Hàn Quốc
Won Hàn Quốc - KRW (₩)
Tiền tệ của Hàn Quốc -
 Dinar Kuwait - KWD (KD)
Tiền tệ của Cô-oét
Dinar Kuwait - KWD (KD)
Tiền tệ của Cô-oét -
 Đô la Quần đảo Cayman - KYD ($)
Tiền tệ của Quần đảo Cayman
Đô la Quần đảo Cayman - KYD ($)
Tiền tệ của Quần đảo Cayman -
 Tenge Kazakhstan - KZT (KZT)
Tiền tệ của Kazakhstan
Tenge Kazakhstan - KZT (KZT)
Tiền tệ của Kazakhstan -
 kip - LAK (₭)
Tiền tệ của Nước Lào
kip - LAK (₭)
Tiền tệ của Nước Lào -
 Bảng Lebanon - LBP (LB£)
Tiền tệ của Liban
Bảng Lebanon - LBP (LB£)
Tiền tệ của Liban -
 Rupee Sri Lanka - LKR (SLRs)
Tiền tệ của Sri Lanka
Rupee Sri Lanka - LKR (SLRs)
Tiền tệ của Sri Lanka -
 Đô la Liberia - LRD (L$)
Tiền tệ của Liberia
Đô la Liberia - LRD (L$)
Tiền tệ của Liberia -
 Loti - LSL (L)
Tiền tệ của Lesotho
Loti - LSL (L)
Tiền tệ của Lesotho -
 Lita Litva - LTL (Lt)
Tiền tệ của Litva
Lita Litva - LTL (Lt)
Tiền tệ của Litva -
 Dinar Libya - LYD (LD)
Tiền tệ của Lybia
Dinar Libya - LYD (LD)
Tiền tệ của Lybia -
 Dirham Ma-rốc - MAD (MAD)
Tiền tệ của Ma-rốc
Dirham Ma-rốc - MAD (MAD)
Tiền tệ của Ma-rốc -
 Leu Moldova - MDL (MDL)
Tiền tệ của Moldova
Leu Moldova - MDL (MDL)
Tiền tệ của Moldova -
 Ariary Malagasy - MGA (MGA)
Tiền tệ của Madagascar
Ariary Malagasy - MGA (MGA)
Tiền tệ của Madagascar -
 Denar Macedonia - MKD (MKD)
Tiền tệ của Macedonia
Denar Macedonia - MKD (MKD)
Tiền tệ của Macedonia -
 tiếng Mông Cổ - MNT (₮)
Tiền tệ của Mông Cổ
tiếng Mông Cổ - MNT (₮)
Tiền tệ của Mông Cổ -
 Kyat Myanma - MMK (MMK)
Tiền tệ của Myanmar
Kyat Myanma - MMK (MMK)
Tiền tệ của Myanmar -
 Pataca Macaca - MOP (MOP$)
Tiền tệ của Macao
Pataca Macaca - MOP (MOP$)
Tiền tệ của Macao -
 Rupee Mauritius - MUR (MURs)
Tiền tệ của Mô-ri-xơ
Rupee Mauritius - MUR (MURs)
Tiền tệ của Mô-ri-xơ -
 Đồng Ringgit Mã Lai - MYR (RM)
Tiền tệ của Malaysia
Đồng Ringgit Mã Lai - MYR (RM)
Tiền tệ của Malaysia -
 Ouguiya - MRO (UM)
Tiền tệ của Mauritanie
Ouguiya - MRO (UM)
Tiền tệ của Mauritanie -
 Rufiyaa - MVR (Rf)
Tiền tệ của Maldives
Rufiyaa - MVR (Rf)
Tiền tệ của Maldives -
 Kwacha - MWK (MK)
Tiền tệ của Malawi
Kwacha - MWK (MK)
Tiền tệ của Malawi -
 Metical Mozambique - MZN (MTn)
Tiền tệ của Mozambique
Metical Mozambique - MZN (MTn)
Tiền tệ của Mozambique -
 Đô la Namibia - NAD (N$)
Tiền tệ của Namibia
Đô la Namibia - NAD (N$)
Tiền tệ của Namibia -
 Naira Nigeria - NGN (₦)
Tiền tệ của Nigeria
Naira Nigeria - NGN (₦)
Tiền tệ của Nigeria -
 Córdoba Nicaragua - NIO (C$)
Tiền tệ của Nicaragua
Córdoba Nicaragua - NIO (C$)
Tiền tệ của Nicaragua -
 Krone Na Uy - NOK (Nkr)
Tiền tệ của Na Uy, Svalbard và Jan Mayen, Đảo Bouvet
Krone Na Uy - NOK (Nkr)
Tiền tệ của Na Uy, Svalbard và Jan Mayen, Đảo Bouvet -
 Rupee Nepal - NPR (NPRs)
Tiền tệ của Nepal
Rupee Nepal - NPR (NPRs)
Tiền tệ của Nepal -
 Đô la New Zealand - NZD (NZ$)
Tiền tệ của New Zealand
Đô la New Zealand - NZD (NZ$)
Tiền tệ của New Zealand -
 Rial Oman - OMR (OMR)
Tiền tệ của Ô-man
Rial Oman - OMR (OMR)
Tiền tệ của Ô-man -
 Balboa Panama - PAB (B\\/.)
Tiền tệ của Panama
Balboa Panama - PAB (B\\/.)
Tiền tệ của Panama -
 Nuevo Sol Peru - PEN (S\\/.)
Tiền tệ của Peru
Nuevo Sol Peru - PEN (S\\/.)
Tiền tệ của Peru -
 kina - PGK (K)
Tiền tệ của Papua New Guinea
kina - PGK (K)
Tiền tệ của Papua New Guinea -
 Peso Philippine - PHP (₱)
Tiền tệ của Philippin
Peso Philippine - PHP (₱)
Tiền tệ của Philippin -
 Rupee Pakistan - PKR (PKRs)
Tiền tệ của Pakistan
Rupee Pakistan - PKR (PKRs)
Tiền tệ của Pakistan -
 Zloty của Ba Lan - PLN (zł)
Tiền tệ của Ba Lan
Zloty của Ba Lan - PLN (zł)
Tiền tệ của Ba Lan -
 Guarani Paraguay - PYG (₲)
Tiền tệ của Paraguay
Guarani Paraguay - PYG (₲)
Tiền tệ của Paraguay -
 Rial Qatar - QAR (QR)
Tiền tệ của Qatar
Rial Qatar - QAR (QR)
Tiền tệ của Qatar -
 Leu Rumani - RON (RON)
Tiền tệ của Rumani
Leu Rumani - RON (RON)
Tiền tệ của Rumani -
 Dinar Serbia - RSD (din.)
Tiền tệ của Serbia
Dinar Serbia - RSD (din.)
Tiền tệ của Serbia -
 Đồng Rúp Nga - RUB (RUB)
Tiền tệ của Nga
Đồng Rúp Nga - RUB (RUB)
Tiền tệ của Nga -
 Franc Rwanda - RWF (RWF)
Tiền tệ của Rwanda
Franc Rwanda - RWF (RWF)
Tiền tệ của Rwanda -
 Riyal Ả Rập Xê Út - SAR (SR)
Tiền tệ của Ả Rập Saudi
Riyal Ả Rập Xê Út - SAR (SR)
Tiền tệ của Ả Rập Saudi -
 Đô la quần đảo Solomon - SBD (SI$)
Tiền tệ của Quần đảo Solomon
Đô la quần đảo Solomon - SBD (SI$)
Tiền tệ của Quần đảo Solomon -
 đồng rupee - SCR (SR)
Tiền tệ của Seychelles
đồng rupee - SCR (SR)
Tiền tệ của Seychelles -
 Bảng Sudan - SDG (SDG)
Tiền tệ của Sudan
Bảng Sudan - SDG (SDG)
Tiền tệ của Sudan -
 Đồng curon Thụy Điển - SEK (Skr)
Tiền tệ của Thụy Điển
Đồng curon Thụy Điển - SEK (Skr)
Tiền tệ của Thụy Điển -
 Đô la Singapore - SGD (S$)
Tiền tệ của Singapore
Đô la Singapore - SGD (S$)
Tiền tệ của Singapore -
 Bảng Thánh Helena - SHP (£)
Tiền tệ của Saint Helena, Đảo Thăng Thiên, Tristan da Cunha
Bảng Thánh Helena - SHP (£)
Tiền tệ của Saint Helena, Đảo Thăng Thiên, Tristan da Cunha -
 Leone - SLL (Le)
Tiền tệ của Sierra Leone
Leone - SLL (Le)
Tiền tệ của Sierra Leone -
 Shilling Somali - SOS (Ssh)
Tiền tệ của Somali
Shilling Somali - SOS (Ssh)
Tiền tệ của Somali -
 Đô la Suriname - SRD ($)
Tiền tệ của Suriname
Đô la Suriname - SRD ($)
Tiền tệ của Suriname -
 Col - SVC (₡)
Tiền tệ của El Salvador
Col - SVC (₡)
Tiền tệ của El Salvador -
 bảng Syria - SYP (SY£)
Tiền tệ của Syria
bảng Syria - SYP (SY£)
Tiền tệ của Syria -
 Lilangeni - SZL (L)
Tiền tệ của Swaziland
Lilangeni - SZL (L)
Tiền tệ của Swaziland -
 Baht Thái - THB (฿)
Tiền tệ của nước Thái Lan
Baht Thái - THB (฿)
Tiền tệ của nước Thái Lan -
 Somoni - TJS (ЅM)
Tiền tệ của Tajikistan
Somoni - TJS (ЅM)
Tiền tệ của Tajikistan -
 manat - TMT (m)
Tiền tệ của Turkmenistan
manat - TMT (m)
Tiền tệ của Turkmenistan -
 Dinar Tunisia - TND (DT)
Tiền tệ của Tunisia
Dinar Tunisia - TND (DT)
Tiền tệ của Tunisia -
 Tongan Paʻanga - TOP (TO)
Tiền tệ của Tonga
Tongan Paʻanga - TOP (TO)
Tiền tệ của Tonga -
 Lira Thổ Nhĩ Kỳ - TRY (TL)
Tiền tệ của Thổ Nhĩ Kỳ
Lira Thổ Nhĩ Kỳ - TRY (TL)
Tiền tệ của Thổ Nhĩ Kỳ -
 Đô la Trinidad và Tobago - TTD (TT$)
Tiền tệ của Trinidad và Tobago
Đô la Trinidad và Tobago - TTD (TT$)
Tiền tệ của Trinidad và Tobago -
 Đô la Đài Loan mới - TWD (NT$)
Tiền tệ của Đài Loan
Đô la Đài Loan mới - TWD (NT$)
Tiền tệ của Đài Loan -
 Shilling Tanzania - TZS (TSh)
Tiền tệ của Tanzania
Shilling Tanzania - TZS (TSh)
Tiền tệ của Tanzania -
 Hryvnia Ucraina - UAH (₴)
Tiền tệ của Ukraina
Hryvnia Ucraina - UAH (₴)
Tiền tệ của Ukraina -
 Shilling Uganda - UGX (USh)
Tiền tệ của Uganda
Shilling Uganda - UGX (USh)
Tiền tệ của Uganda -
 Peso của Uruguay - UYU ($U)
Tiền tệ của Uruguay
Peso của Uruguay - UYU ($U)
Tiền tệ của Uruguay -
 Som Uzbekistan - UZS (UZS)
Tiền tệ của Uzbekistan
Som Uzbekistan - UZS (UZS)
Tiền tệ của Uzbekistan -
 Đồng Bolívar của Venezuela - VES (Bs.F.)
Tiền tệ của Venezuela
Đồng Bolívar của Venezuela - VES (Bs.F.)
Tiền tệ của Venezuela -
 đồng Việt Nam - VND (₫)
Tiền tệ của Việt Nam
đồng Việt Nam - VND (₫)
Tiền tệ của Việt Nam -
 Vatu - VUV (VT)
Tiền tệ của Vanuatu
Vatu - VUV (VT)
Tiền tệ của Vanuatu -
 Tala - WST (WS$)
Tiền tệ của Samoa
Tala - WST (WS$)
Tiền tệ của Samoa -
 CFA Franc BEAC - XAF (FCFA)
Tiền tệ của Cameroon, Cộng hòa Trung Phi, Cộng hòa Congo, Tchad, Guinea Xích Đạo, Gabon
CFA Franc BEAC - XAF (FCFA)
Tiền tệ của Cameroon, Cộng hòa Trung Phi, Cộng hòa Congo, Tchad, Guinea Xích Đạo, Gabon -
 đô la Caribe - XCD ($)
Tiền tệ của Antigua và Barbuda, Anguilla, Dominica, Grenada, Montserrat, Saint Kitts và Nevis, Saint Lucia, Saint Vincent và Grenadines
đô la Caribe - XCD ($)
Tiền tệ của Antigua và Barbuda, Anguilla, Dominica, Grenada, Montserrat, Saint Kitts và Nevis, Saint Lucia, Saint Vincent và Grenadines -
 Franc CFA BCEAO - XOF (CFA)
Tiền tệ của Bénin, Burkina Faso, Côte d'Ivoire, Guinea-Bissau, Mali, Niger, Senegal, Togo
Franc CFA BCEAO - XOF (CFA)
Tiền tệ của Bénin, Burkina Faso, Côte d'Ivoire, Guinea-Bissau, Mali, Niger, Senegal, Togo -
 Franc CFP - XPF (₣)
Tiền tệ của Wallis và Futuna
Franc CFP - XPF (₣)
Tiền tệ của Wallis và Futuna -
 Rial Yemen - YER (YR)
Tiền tệ của Yêmen
Rial Yemen - YER (YR)
Tiền tệ của Yêmen -
 Đơn vị tiền tệ tiêu chuẩn được sử dụng ở Nam Phi - ZAR (R)
Tiền tệ của Lesotho, Namibia, Nam Phi
Đơn vị tiền tệ tiêu chuẩn được sử dụng ở Nam Phi - ZAR (R)
Tiền tệ của Lesotho, Namibia, Nam Phi -
 Đồng Kwacha của Zambia - ZMW (ZK)
Tiền tệ của Zambia
Đồng Kwacha của Zambia - ZMW (ZK)
Tiền tệ của Zambia
CAD =
VND
Đô la Canada =
đồng Việt Nam
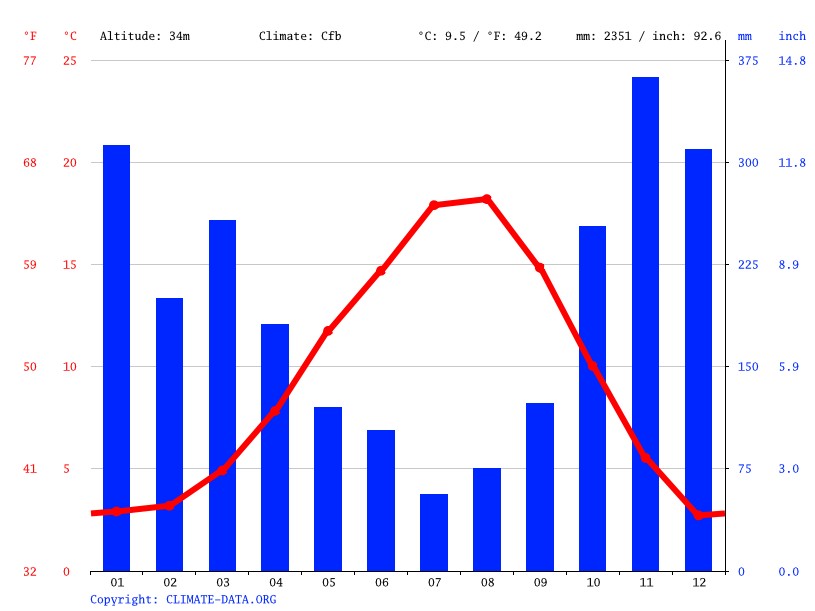
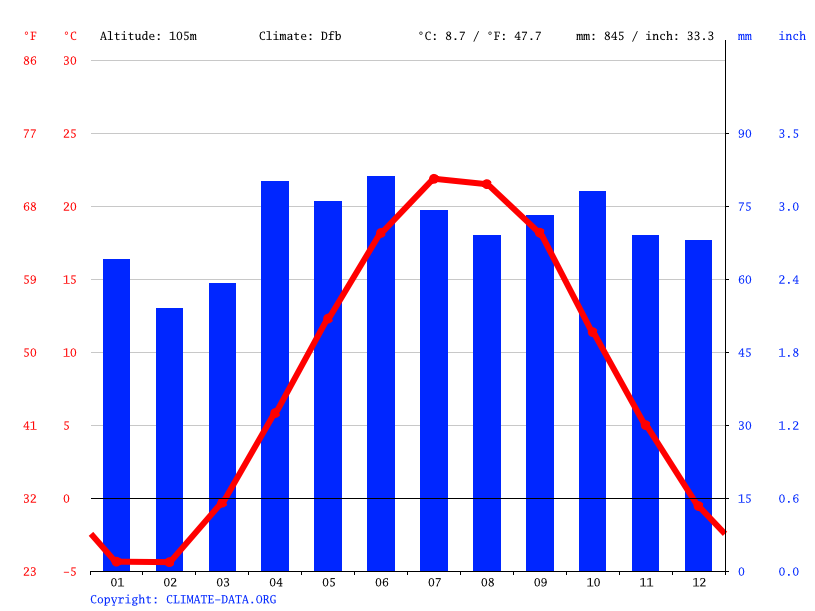
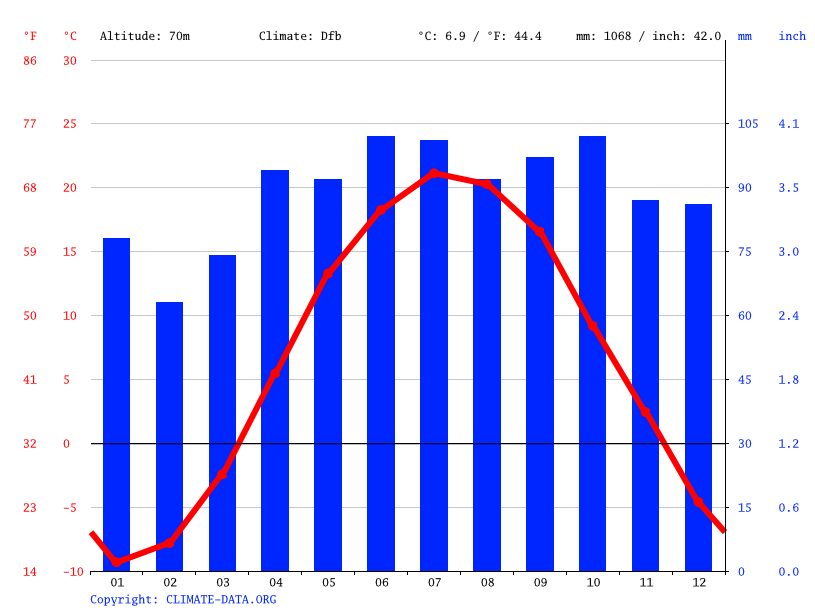
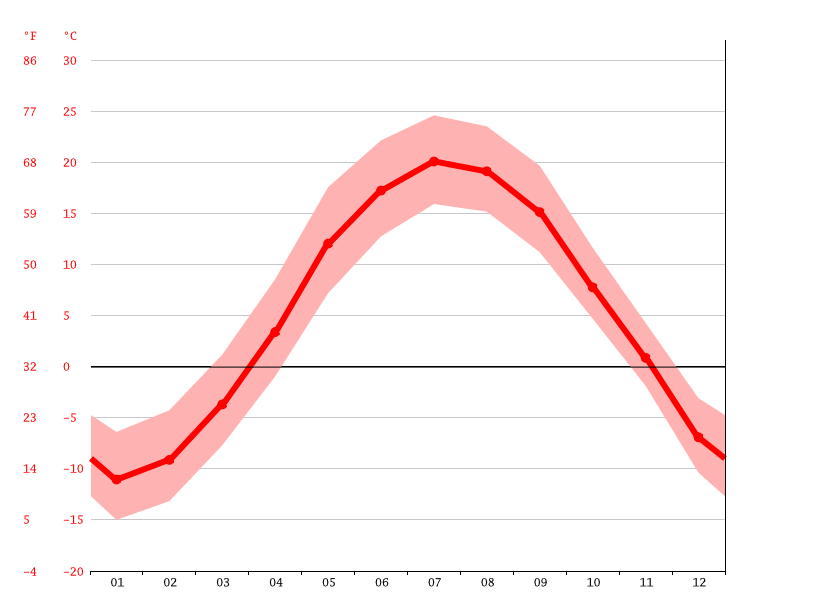
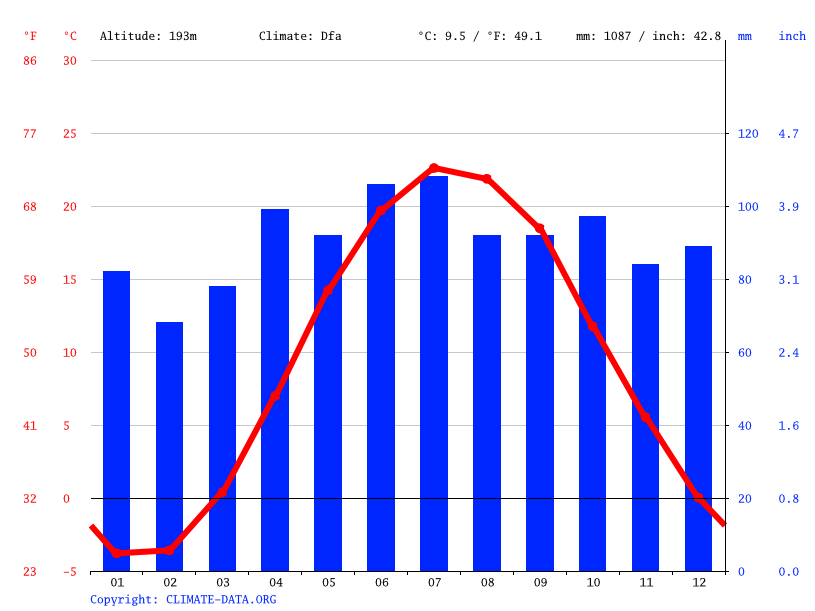
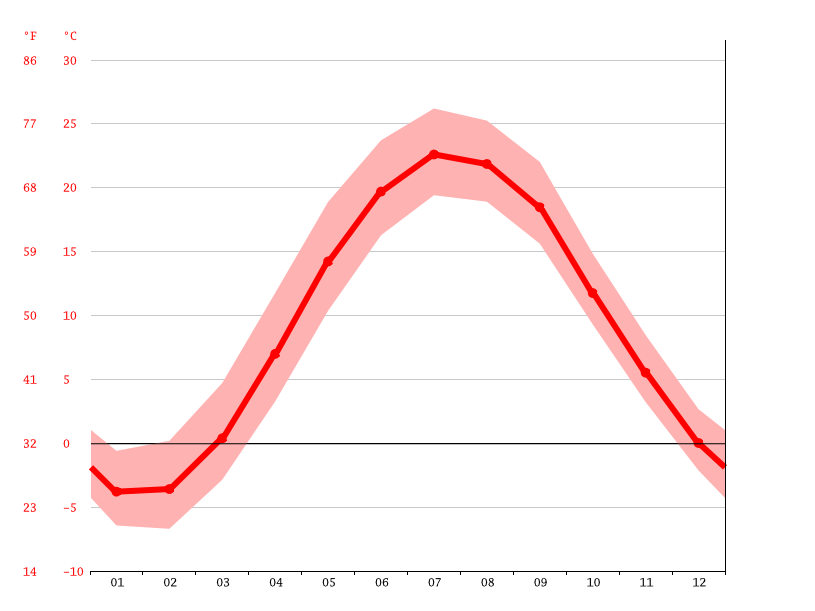
 Nhiệt độ
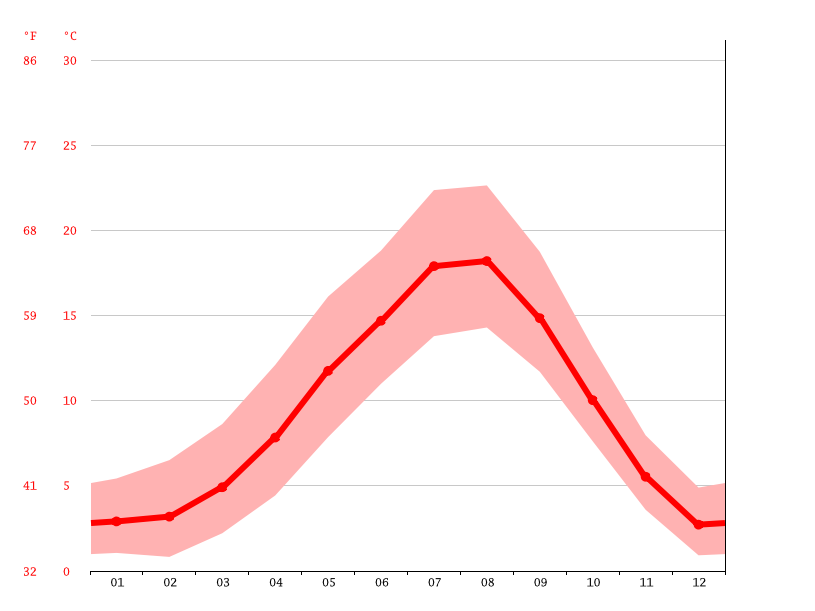
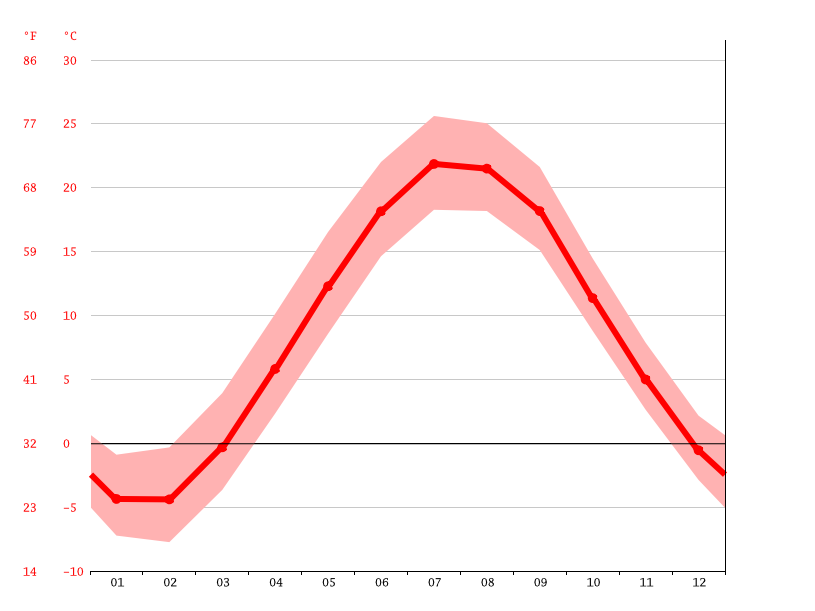
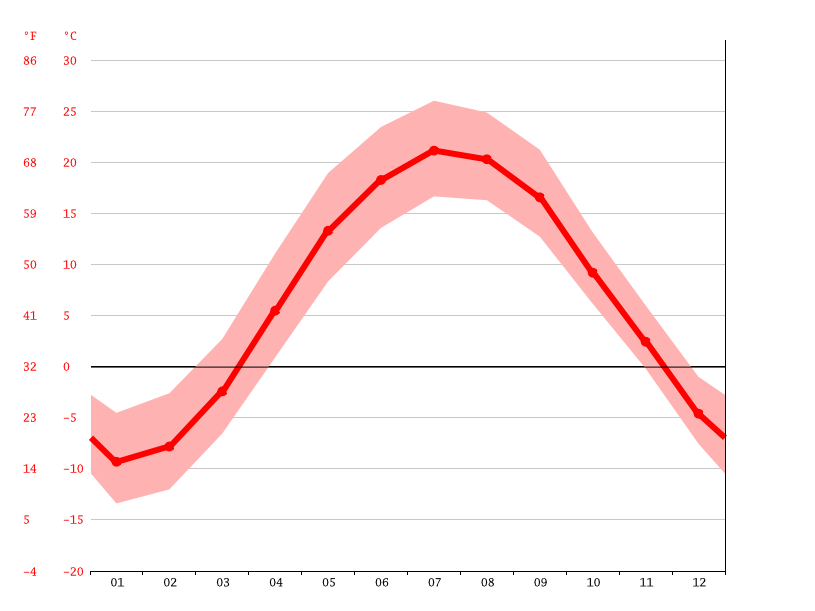